We have undertaken numerous projects in the realm of process improvement and automation. Our team has worked with various clients across different industries, delivering tailored solutions to enhance operational efficiency and streamline workflows. From developing custom data analysis tools to implementing automated reporting systems, we have consistently met and exceeded our clients’ expectations. See below for projects we have worked on and what our clients have said.
(Labels and data have been changed to protect privacy)

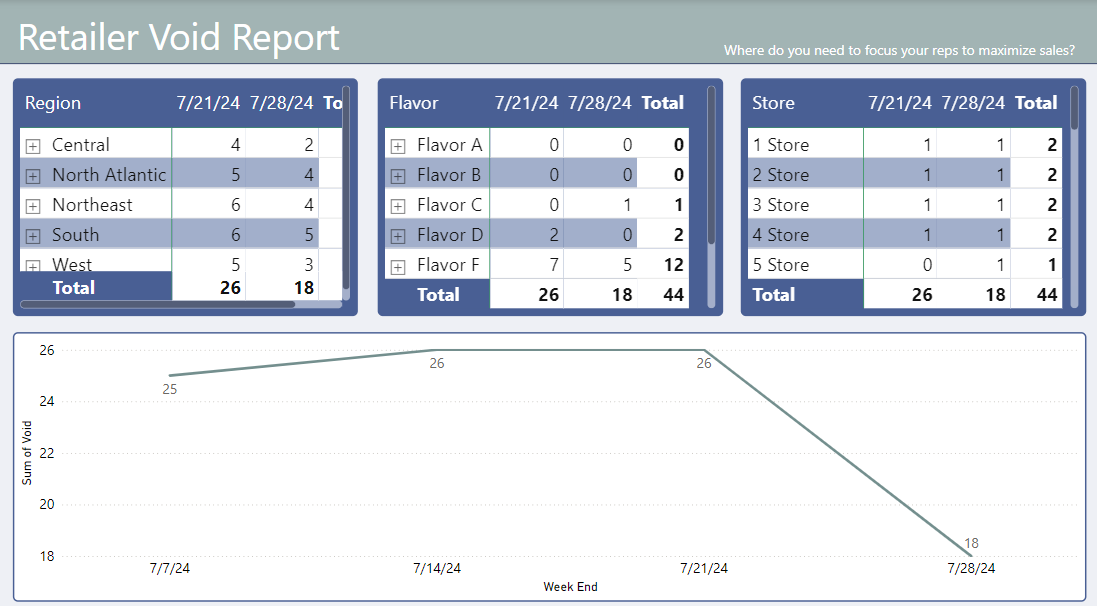
This is a very powerful report to help maximize sales. This report is an excellent example of taking something manual and automating it. The original report was created into a pivot table and someone manually went store by store flavor by flavor to try and identify voids/OOS. This process took hours to days to complete. Through automation and formulas, this current dashboard was created. There is no manual entry or scanning through stores. The data spits out in the matter of minutes! An identical dashboard was created for OOS as well as voids. This purpose of this was to export the data to send to the sales reps and have them address any issues in their territory.

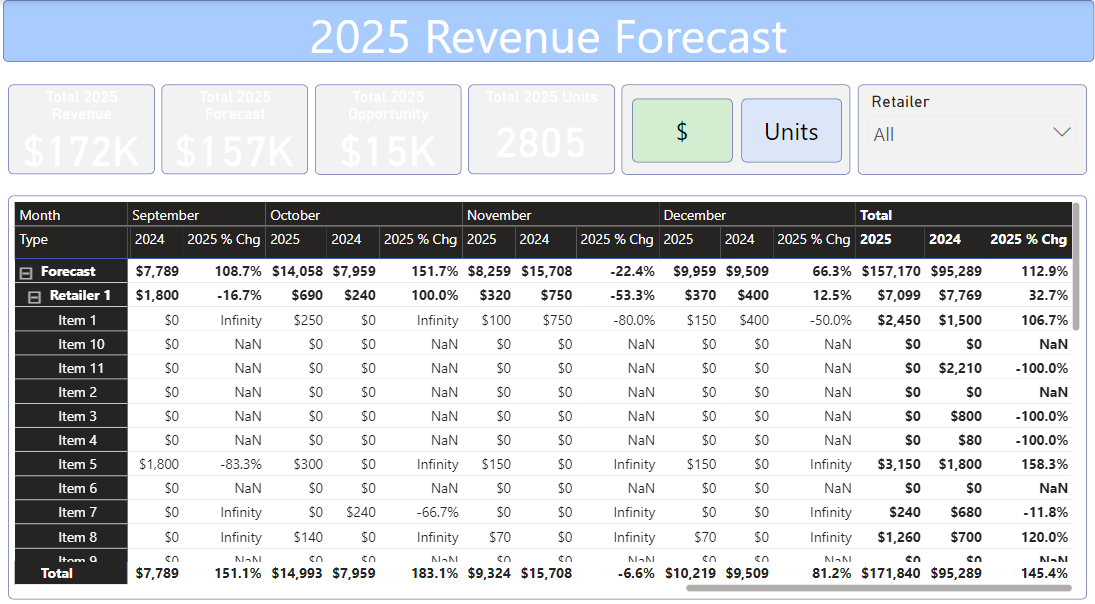
This report showcases important sales information. This can be used to present to key stakeholders, make data driven decisions, forecasting, and much more.

This report is showing what is happening with invoices, why it is happening, and how to prevent it. The ultimate goal is to make process improvements for invoices.

This report is providing complex sales forecasting created in excel, which then feeds into a power bi dashboard for sales rep review.

This report shows a revenue forecast turned into a production forecast through complex formulas and customer trends. This is broken down for weekly production runs and monitored by operation

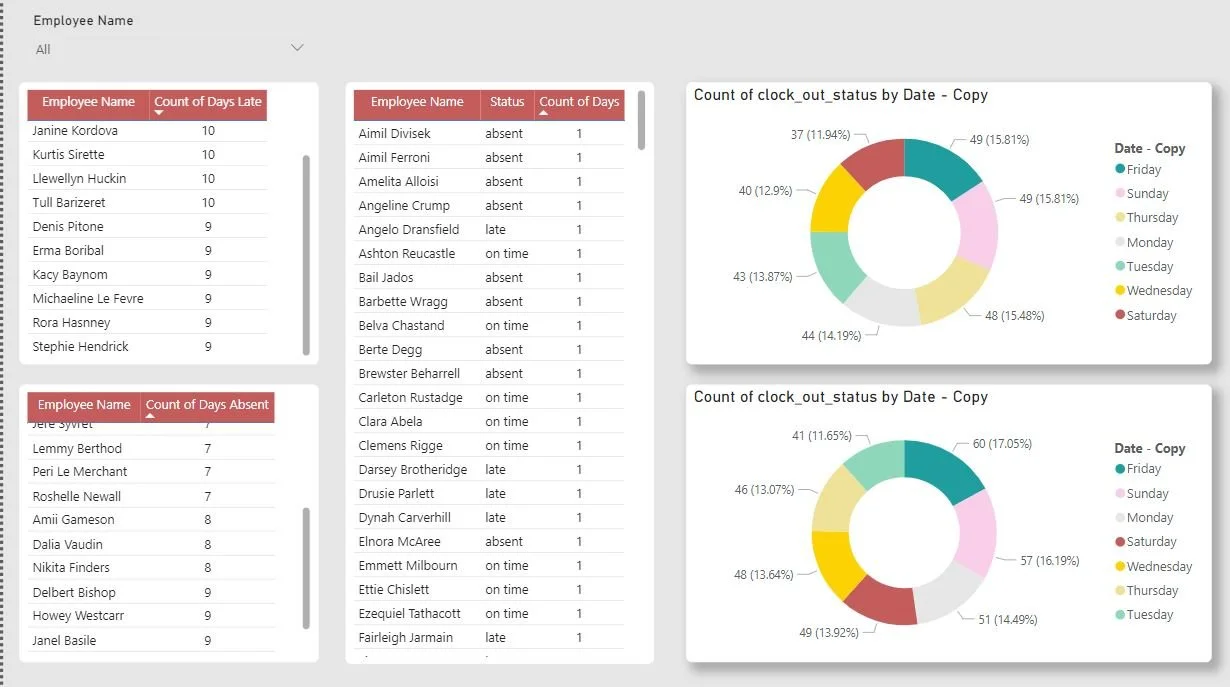
This report looks at employees clock in status. It calculates if they are late, absent, or on time. It can help predict which days are most common for late/absent employees, or top employees who are late/absent.

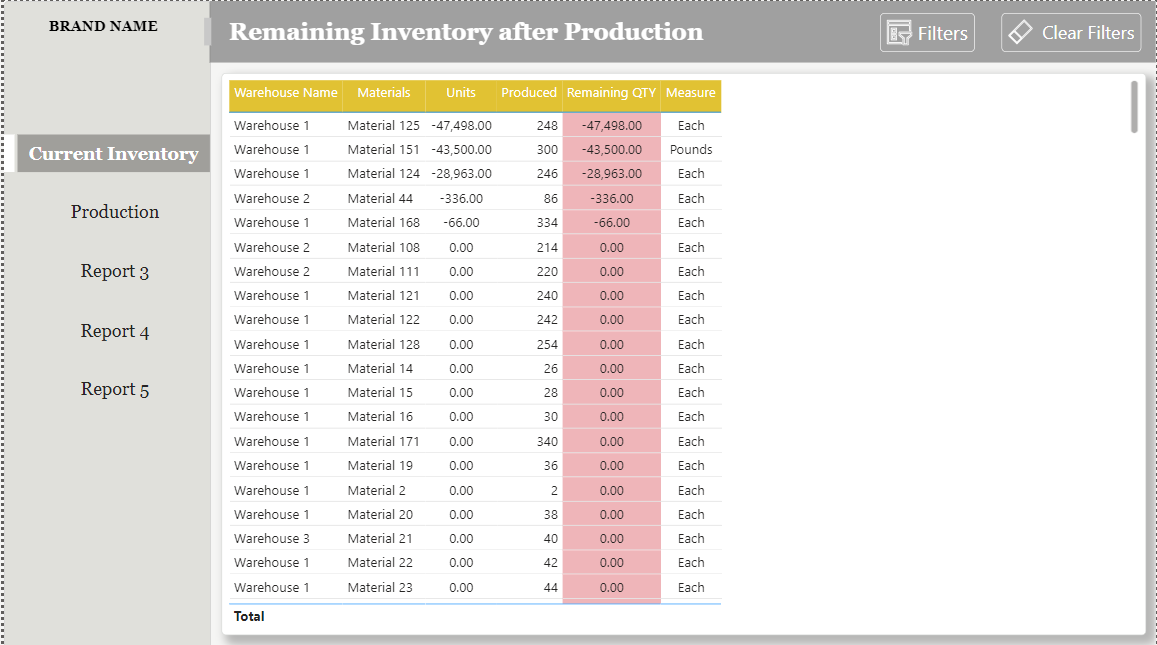
This report helps forecast inventory levels based on a production schedule. Items that are below or equal to 0 will be highlighted red to show inventory will be needed. There can be additional tabs to have all your information in one spot. Such as, production schedule, PO list, invoice list, etc.